info@carolinamountainre.com
    (864) 610-0775

Carolina Mountain Real EstateCarolina Mountain Real Estate

Luxury Properties of the Carolinas and The Cliffs Real Estate

  • Property Search
  • Communities
    • Cliffs Valley
    • Cliffs at Glassy
    • Cliffs at Keowee Falls
    • Cliffs at Mountain Park
    • Cliffs at Keowee Springs
    • Cliffs at Keowee Vineyards
    • Crescent Mtn Vineyards
    • Montebello
    • Preserve at Rock Creek
    • Reserve at Lake Keowee
  • Featured Properties
    • Commercial Properties
    • The Cliffs Lots for Sale
  • Partners
    • Arthur Rutenberg Homes
    • Dillard Jones Builders
    • Fairview Builders
    • Milestone Custom Homes
    • Morgan-Keefe Builders
    • Villa Verona Design
  • Area Info
    • Greenville SC
    • Asheville NC
  • About Us
    • Contact Us
    • Meet Our Team

May 2018 Greenville SC Real Estate Market

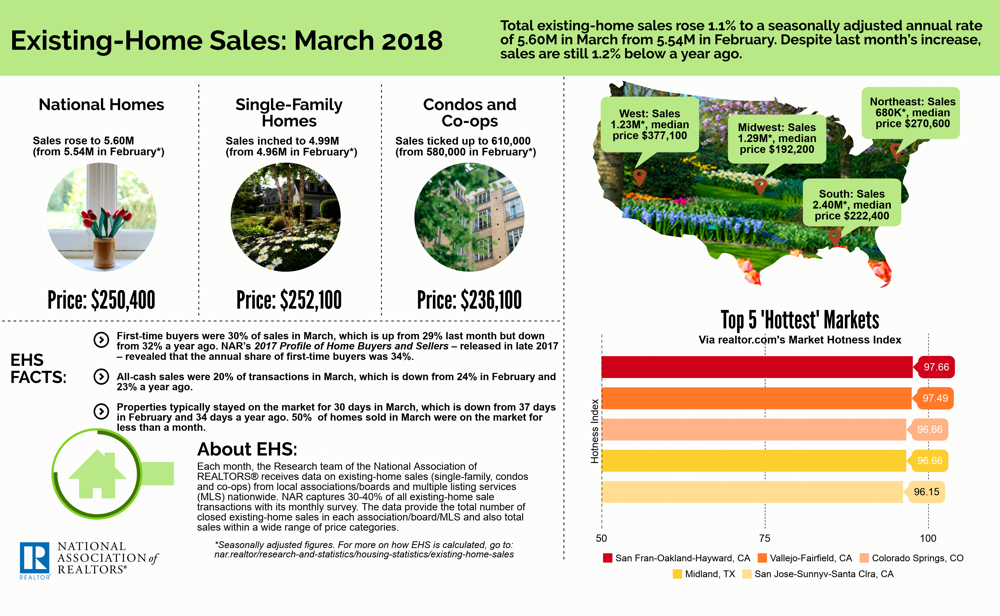
The National Association of Realtors® reported that after moving upward for two straight months, existing-home sales nationally retreated in April on both a monthly and annualized basis. All four major regions (South, West, Midwest, & Northeast) saw no gain in sales activity last month.

The Greenville SC Real Estate market was no exception. A comparison between March and April 2018 shows a decrease of 4.9 percent in the number of units sold and a very slight decrease of 0.8 percent in the Average Sold Price. However, from April of last year, both the number of units sold and the Average Sold Price has increased as shown in the numbers below.

April 2018 Existing Homes Sales

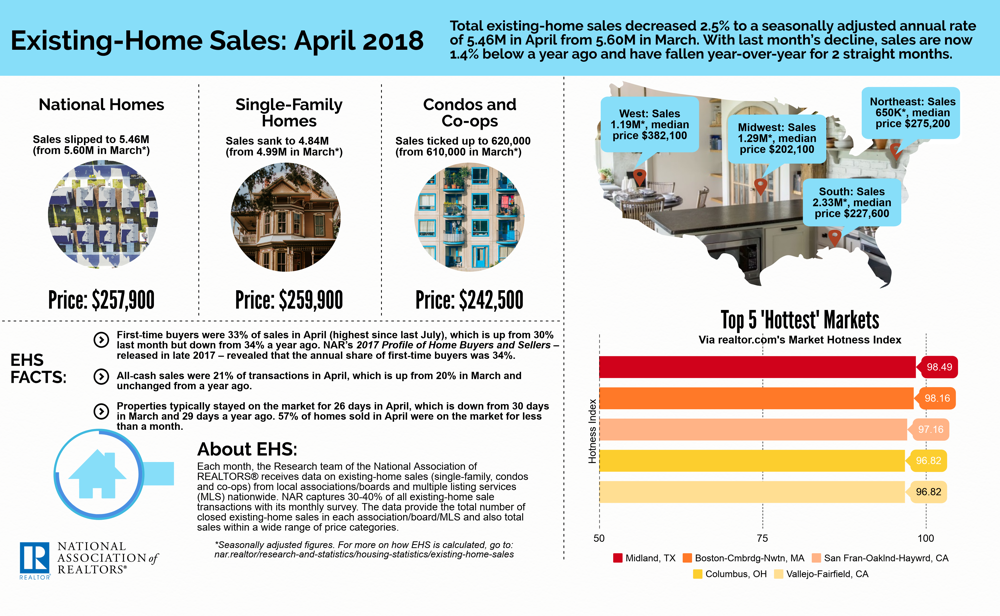
Comparison Stats for April 2017/2018:

 Greenville SC Avg DOM # Units Sold Avg Sold Price
April 2017 60 1035 $218,732
April 2018 55 1148 $234,704
% Inc/Decrease -8.3% +10.9% +7.3%

Caesars Head State Park

At 3,208 feet above sea level, Caesars Head State Park is a granitic gneiss outcropping atop the Blue Ridge Escarpment.

From this dramatic ledge, safely behind a strong fence, you have a panoramic view of the Blue Ridge Mountains and surrounding country, which includes (as seen in the accompanying photo) Table Rock State Park and Table Rock Reservoir.

LEARN MORE ABOUT GREENVILLE


National Real Estate Market

May 2018
“This Month in Real Estate”

Knowing the current real estate market conditions can help you decide if you want to list your property or if it is a good time to buy.

This short video from KW® Realty highlights the most recent real estate market conditions in the US as of May 2018.

*Video by KW® Realty.

*All information/graphs are from the Greater Greenville Association of Realtors® or The National Association of Realtors® and used with permission. All other use restricted. 

While representative of market activity, this report may not include all sales brokered by Member firms, and should not be viewed as all inclusive of sales transacted within the referenced time periods.

Posted in: Blog Tagged: greenville sc real estate, national real estate market, national real estate video, real estate, real estate market greenville sc, sales report

April 2018 Greenville SC Real Estate Market

The National Association of Realtors® reported that although March showed a 1.1 increase in homes sales, nationally homes sales are 1.2 percent below a year ago.

The Greenville market in comparison shows an 8 percent increase in  home sales between the 1st Quarter 2017 and 2018, as well as a 3 percent increase in home sales in March. The Greenville market continues to expand!

2018 Infographic from NAR.

Comparison Stats for March 2017/2018:

Greenville SC Avg DOM # Units Sold Avg Sold Price
March 2017 61 1168 $212,397
March 2018 61 1208 $236,628
% Inc/Decrease 0% +3.4% +11.4%

Comparison Stats for 1st Quarter 2017/2018:

Greenville SC Avg DOM # Units Sold Avg Sold Price
1st Quarter 2017 63 2663 $208,754
1st Quarter 2018 60 2894 $234,223
% Inc/Decrease -4.7% +8.6% +12.2%

National Real Estate Market

April 2018
“This Month in Real Estate”

Knowing the current real estate market conditions can help you decide if you want to list your property or if it is a good time to buy
This short video from KW® Realty highlights the most recent real estate market conditions in the US as of April 2018

*Video by KW® Realty.

*All information/graphs are from the Greater Greenville Association of Realtors® or The National Association of Realtors® and used with permission. All other use restricted. 

While representative of market activity, this report may not include all sales brokered by Member firms, and should not be viewed as all inclusive of sales transacted within the referenced time periods.

Posted in: Blog Tagged: greenville sc real estate, national real estate market, national real estate video, real estate, real estate market greenville sc, sales report

March 2018 Greater Greenville Real Estate Market

Greenville recently ranked number 39 on Livability’s 2018 Top 100 Best Place to Live. The site polls folks from around the nation to determine what consumers want: health care, affordable housing, shorter commute times and climate, just to name a few.
Then they “source the best public and private data available to find the small to mid-sized cities, towns and villages” that meet the standards mentioned previously of a Best Place to Live.

The article points out that Greenville ranked high due to our strong job market, education opportunities, health care, shopping, entertainment, etc. Read the full article for more details.

sunrise in the Blue Ridge Mountains


Comparison Stats for February 2017/2018:

Avg DOM # Units Sold Avg Sold Price
February 2017 72 784 $205,178
February 2018 62 870 $234,606
% Inc/Decrease -13.8% +10.9% +14.3%

LEARN MORE ABOUT GREENVILLE


National Real Estate Market

March 2018
“This Month in Real Estate”

This short video from KW® Realty highlights the most recent real estate market conditions in the US as of March 2018.

Knowing the current real estate market conditions can help you decide if you want to list your property or if it is a good time to buy.

*Video by KW® Realty.

*All information/graphs from the Greater Greenville Association of Realtors® or The National Association of Realtors®. 

While representative of market activity, this report may not include all sales brokered by Member firms, and should not be viewed as all inclusive of sales transacted within the referenced time periods.

Posted in: Blog Tagged: greenville real estate, greenville sc real estate

February 2018 Greater Greenville Real Estate Market

From our beautiful Falls Park on the Reedy River in downtown Greenville to Pinnacle Mountain, the tallest mountain contained entirely within the state of South Carolina at 3,415 feet – the Upstate is a great place to live.

A recent article by The Washington Post brought out that “today it (Greenville) has a wide-ranging (and well-priced) food scene; quirky boutiques; outdoor cafes on bustling, tree-lined, pedestrian-friendly streets; art galleries; bike trails; ample urban green space; a public art collection with more than 70 sculptures; and the fastest-growing population of any city in the state.”

Our real estate market reflects that folks don’t just vacation hear, they call it home.

Comparison Stats for January 2017/2018:

Avg DOM # Units Sold Avg Sold Price
January 2017 58 679 $211,647
January 2018 58 780 $235,607
% Inc/Decrease 0% +14.9% +11.3%


LEARN MORE ABOUT GREENVILLE


National Real Estate Market

February 2018
“This Month in Real Estate”

Knowing the current real estate market conditions can help you decide if you want to list your property or if it is a good time to buy.

This short video from KW® Realty highlights the most recent real estate market conditions in the US as of February 2018.

*Video by KW® Realty.

 G

*All information/graphs from the Greater Greenville Association of Realtors® or The National Association of Realtors®. While representative of market activity, this report may not include all sales brokered by Member firms, and should not be viewed as all inclusive of sales transacted within the referenced time periods.

r

eater Greenville Real Estate Market – February 2018

Posted in: Blog Tagged: greenville sc real estate, national real estate market, real estate greenville sc, real estate market greenville sc, real estate video, vacation in greenville sc, video real estate

The Cliffs 2017 Sales Report

The Cliffs 2017 sales report is in! The following data and graphs were created using sales information reported to our local Greater Greenville Multiple Listing Service, of which we are members. Private sales are not included.

Valley, Glassy, Mountain Park

LOTS / HOMESITES

The Cliffs 2017 Sales Report - Lots Sold Comparison Graph


2017 Homesites/Lots Sold
Community # Sold Average List $ Average Sold $
The Cliffs Valley 13 $107,415 $81,269
The Cliffs at Glassy 16 $46,074 $39,231
The Cliffs at Mtn Park 15 $171,010 $154,960
Total 2017 Lots Sold 44 $106,789 $91,104

Valley, Glassy, Mountain Park

Residental / Homes

The Cliffs 2017 Sales Report - Homes Sales Comparison

2017 Homes Sold
Community # Sold Average List $ Average Sold $
The Cliffs Valley 22 $717,995 $662,768
The Cliffs at Glassy 15 $595,380 $539,280
The Cliffs at Mtn Park 7 $910,285 $857,500
Total 2017 Homes Sold 44 $706,786 $651,650


*While representative of market activity, this report may not include all sales brokered by Member firms, and should not be viewed as all inclusive of sales transacted within the referenced time periods.*

The Cliffs 2017 Sales Report

Posted in: Blog Tagged: 2017 sold information the cliffs, cliffs 2017 sales report, cliffs real estate, cliffs real estate sales, glassy homes sold, glassy lots sold, mountain park homes sold, mountain park lots sold, the cliffs, valley homes sold, valley lots sold

January 2018 Greater Greenville Real Estate Market

The cumulative historical statistics are in for the Greater Greenville Real Estate Market as of January 2018. This information is reflective of Residential Single Family and Condo/Townhouse sales. Please view the tables below.

Comparison Stats for January 1 – December 31, 2016/2017:

Avg DOM # Units Sold Avg Sold Price
Jan-Dec 2016 62 12,198 $212,306
Jan-Dec 2017 54 12,598 $227,262
% Inc/Decrease -12.9% +3.3% +7%


Comparison Stats for December 2016/2017:


Avg DOM # Units Sold Avg Sold Price
December 2016 64 933 $215,369
December 2017 59 1,034 $227,849
% Inc/Decrease -7.8% +10.8% +5.8%


LEARN MORE ABOUT GREENVILLE


National Real Estate Market

January 2018
“This Month in Real Estate”

Knowing the current real estate market conditions can help you decide if you want to list your property or if it is a good time to buy.

This short video from KW® Realty highlights the most recent real estate market conditions in the US as of January 2018.


*Video by KW® Realty.

*All information/graphs from the Greater Greenville Association of Realtors® or The National Association of Realtors®.

The Greater Greenville Real Estate Market – January 2018

Posted in: Blog

Posts navigation

  • 1
  • 2
  • 3
  • …
  • 6
  • Next Page »

About Us

Carolina Mountain Real Estate is a boutique real estate firm where every decision is centered on developing personal relationships based on honesty, integrity and real estate professionalism. We offer a seasoned sales and listing staff with a combined total of 50+ years of experience.

Contact Us

3598 Highway 11, Suite 108
Travelers Rest, SC 29690
 
(864) 610-0775
 
info@carolinamountainre.com

Search Tools

Basic Search

My Account

Advanced Search

Home Valuation

Map Search

Mortgage Calculator

Information contained in this web site is deemed reliable but not guaranteed. All properties are subject to prior sale, change or withdrawal notice. Prices and availability subject to change. All specifications supplied by builder/seller, and subject to change or modification. Membership classification and availability are subject to change. It is the responsibility of the buyer or buyer's agent to verify.
- W. David Robertson, Broker-in-Charge / Carolina Mountain Real Estate, LLC

© 2023 · Equity Framework / Log in