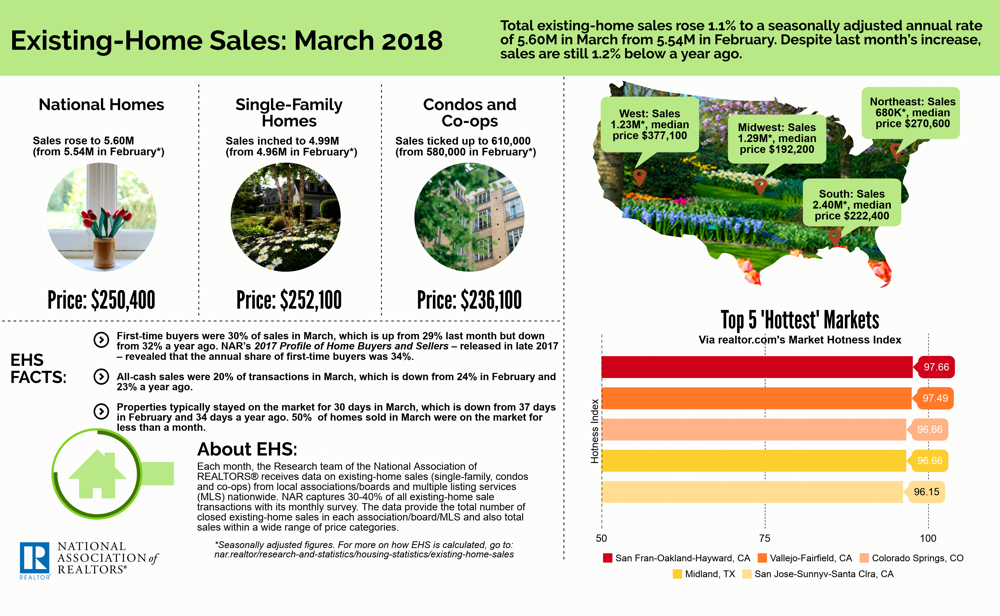
The National Association of Realtors® reported that although March showed a 1.1 increase in homes sales, nationally homes sales are 1.2 percent below a year ago.
The Greenville market in comparison shows an 8 percent increase in home sales between the 1st Quarter 2017 and 2018, as well as a 3 percent increase in home sales in March. The Greenville market continues to expand!
Comparison Stats for March 2017/2018:
| Greenville SC | Avg DOM | # Units Sold | Avg Sold Price |
| March 2017 | 61 | 1168 | $212,397 |
| March 2018 | 61 | 1208 | $236,628 |
| % Inc/Decrease | 0% | +3.4% | +11.4% |
Comparison Stats for 1st Quarter 2017/2018:
| Greenville SC | Avg DOM | # Units Sold | Avg Sold Price |
| 1st Quarter 2017 | 63 | 2663 | $208,754 |
| 1st Quarter 2018 | 60 | 2894 | $234,223 |
| % Inc/Decrease | -4.7% | +8.6% | +12.2% |
National Real Estate Market
April 2018
“This Month in Real Estate”
Knowing the current real estate market conditions can help you decide if you want to list your property or if it is a good time to buy
This short video from KW® Realty highlights the most recent real estate market conditions in the US as of April 2018
*All information/graphs are from the Greater Greenville Association of Realtors® or The National Association of Realtors® and used with permission. All other use restricted.
While representative of market activity, this report may not include all sales brokered by Member firms, and should not be viewed as all inclusive of sales transacted within the referenced time periods.
Leave a Reply