A yearly comparison between June 2017 and June 2018 shows an 11 percent increase in the Average Sold Price for homes and a 2 and half percent increase in the number of units sold last year.
Comparison Stats for JULY 2017/2018:
| Greenville SC Homes Sold | AVG DOM | # SOLD | AVG SOLD PRICE |
| July 2017 | 48 | 1232 | $ 227,640 |
| July 2018 | 48 | 1263 | $ 252,993 |
| Percentage -/+ | 0 % | +2.5% | +11% |
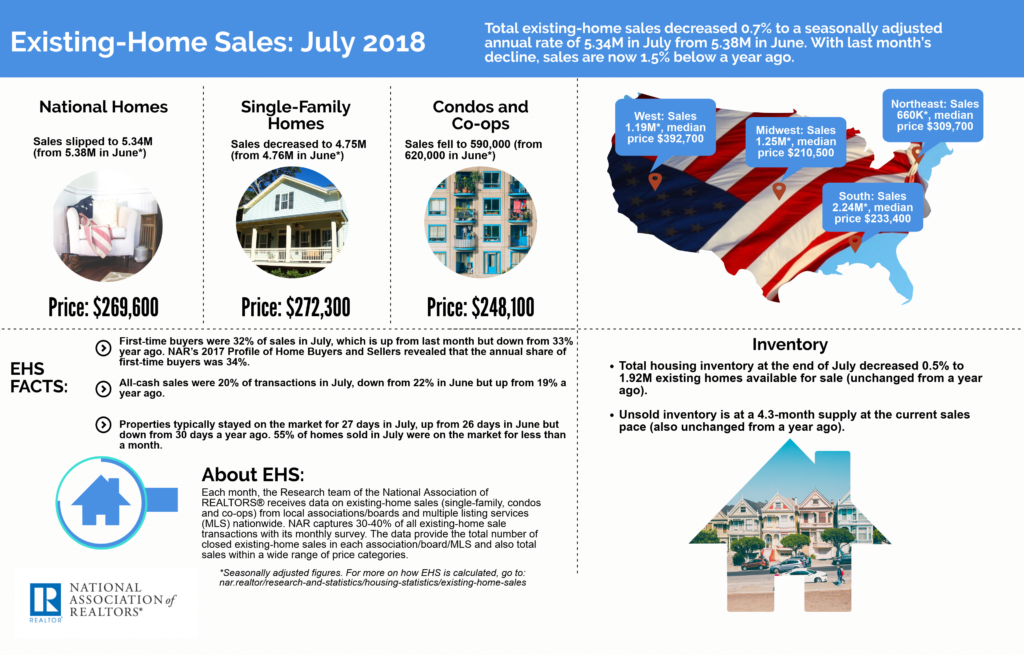
National Real Estate Market
The NAR report pointed out that “continuous solid gains in home prices have now steadily reduced demand.” So, would-be buyers are being priced out of the market waiting for prices to fall.
Read moreAll information/graphs are from the Greater Greenville Association of Realtors® or The National Association of Realtors® and used with permission. All other use restricted.
While representative of market activity, this report may not include all sales brokered by Member firms, and should not be viewed as all inclusive of sales transacted within the referenced time periods.


Leave a Reply