The number of Units Sold increased from January to February 2019. January reported 655 Units Sold and February reported 986 Units Sold. That’s a huge 50 percent increase!
Comparison Stats for FEBRUARY 2018 / 2019:
| Greenville SC Homes Sold | AVG DOM | # SOLD | AVG SOLD PRICE |
| FEBRUARY 2018 | 61 | 875 | $ 234,302 |
| FEBRUARY 2019 | 61 | 986 | $ 230,922 |
| Percentage -/+ | 0% | +12.6% | -1.4% |
Greenville is ranked among the Top 100 Best Places to live according to Livability.com’s Best Places to Live and Top 10 Best Downtowns in America. Livability.com noted that Greenville is a “city with a strong job market that helps draw many young professionals to live and work”.
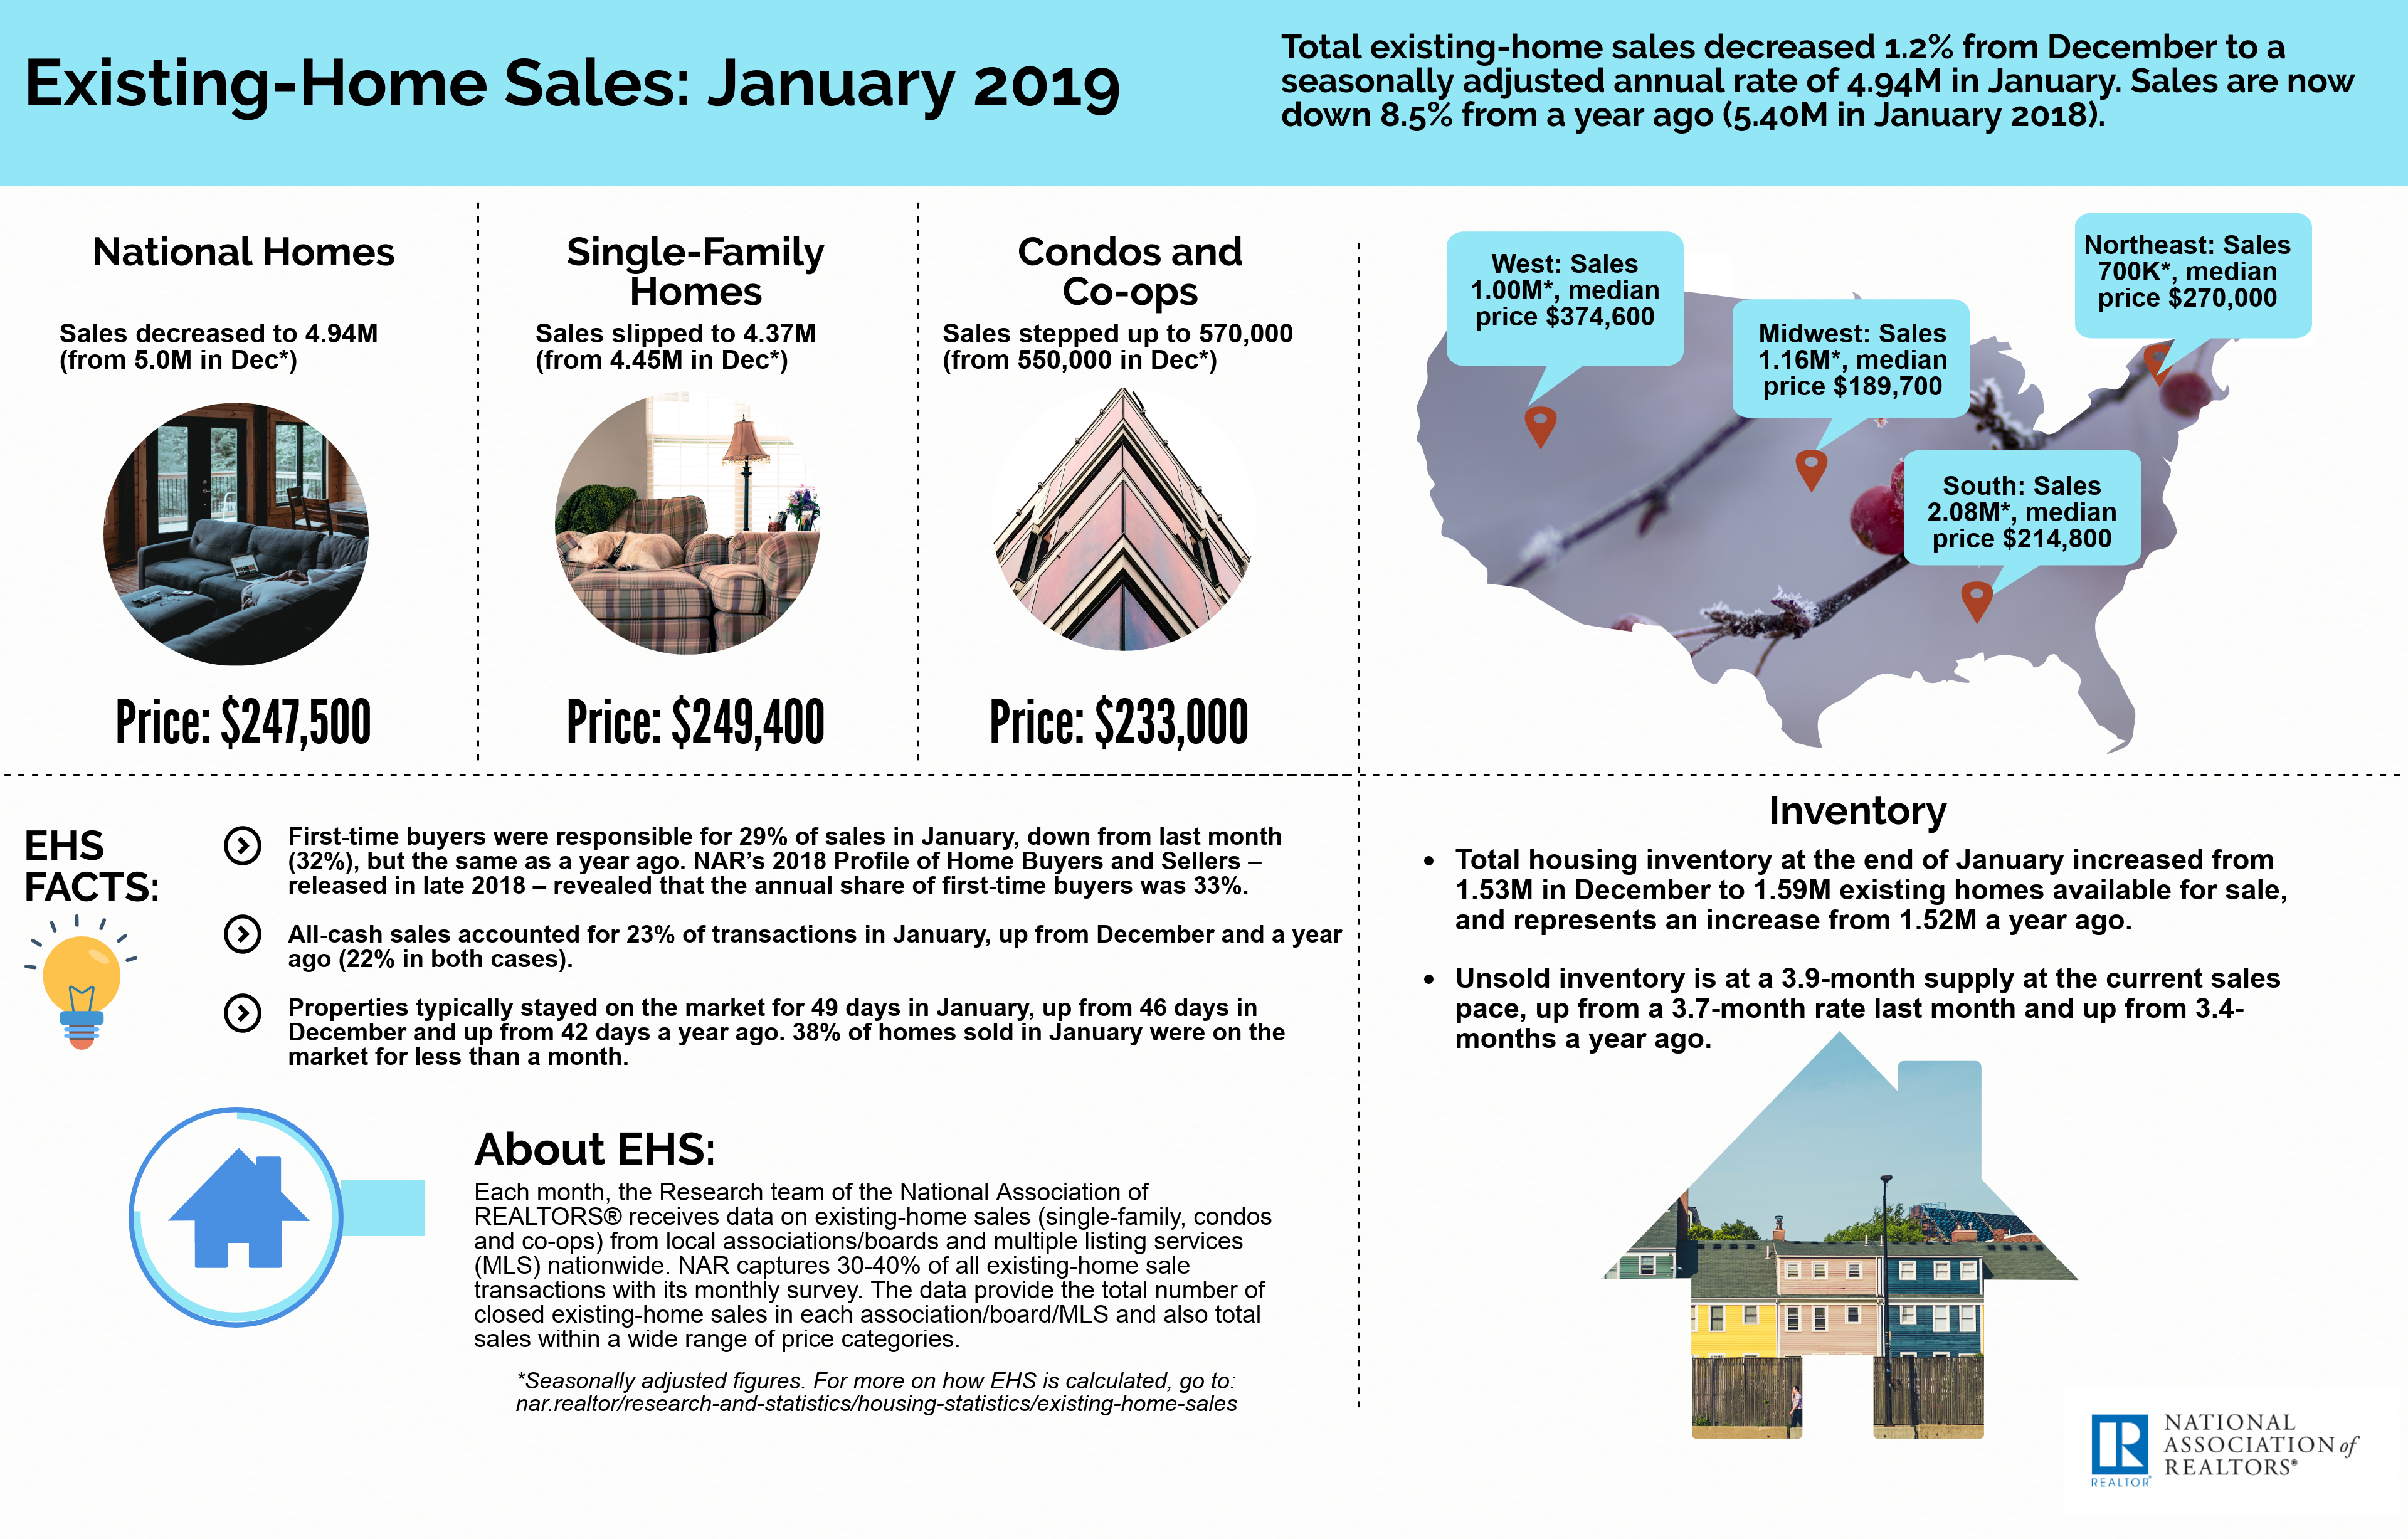
National Real Estate Market
February 2019 experienced the largest month-over-month gain since December 2015, according to the National Association of Realtors®. Three of the four major U.S. regions saw sales gains, while the Northeast remained unchanged from last month.
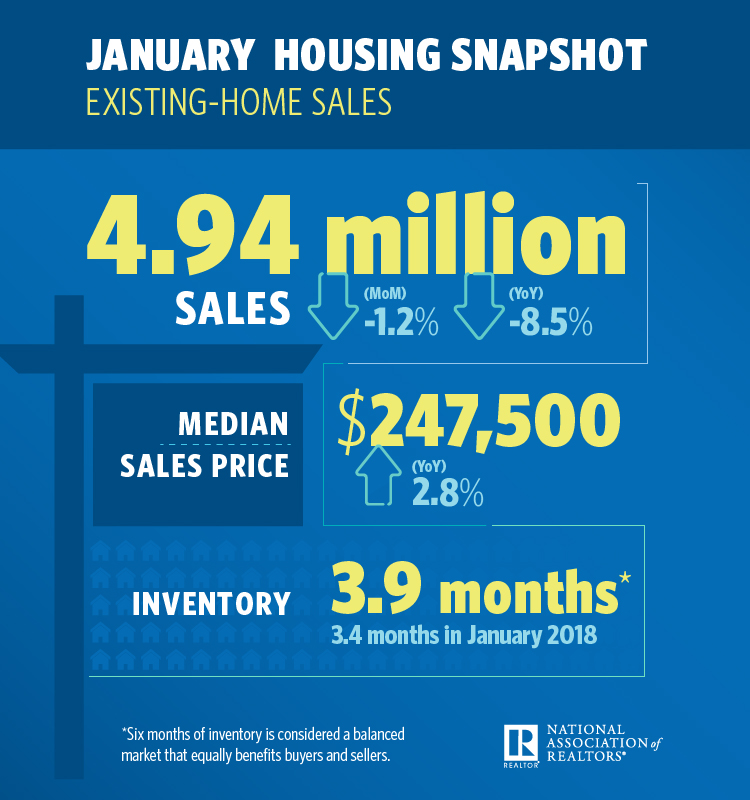
Existing-home sales increased by 11.8 percent from January to a seasonally adjusted annual rate of 5.51 million in February. However, sales are down 1.8 percent from a year ago (5.61 million in February 2018).
Lawrence Yun, NAR’s chief economist, credited a number of aspects to the jump in February sales. “A powerful combination of lower mortgage rates, more inventory, rising income and higher consumer confidence is driving the sales rebound.”
Existing-home sales in the South grew 14.9 percent to an annual rate of 2.39 million in February, down 0.4 percent from last year. The median price in the South was $219,300, up 2.5 percent from a year ago.
Read more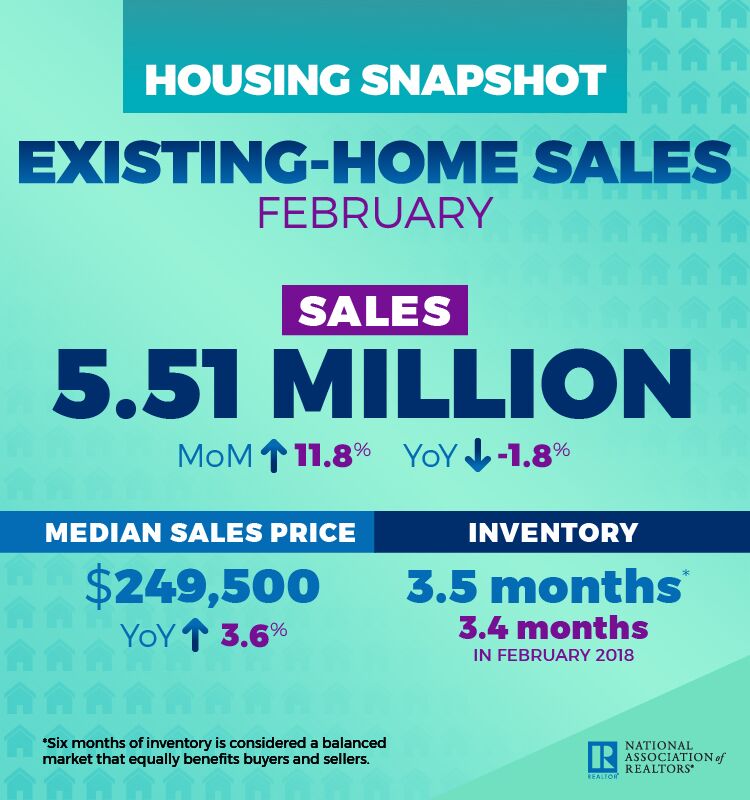
All information/graphs are from the Greater Greenville Association of Realtors® or The National Association of Realtors® and used with permission. All other use restricted.
While representative of market activity, this report may not include all sales brokered by Member firms, and should not be viewed as all inclusive of sales transacted within the referenced time periods.