
November 2018 Greater Greenville Real Estate Market – Greenville’s local market showed an increase in the Number of Units Sold (+3.6%) and Average Sold Price (3.8%) from September to October 2018.
Also, as the following table shows, the Number of Units Sold has increased by over 8 percent and the Average Sold Price over 5 percent from October 2017 to October 2018.
Comparison Stats for OCTOBER 2017/2018:
| Greenville SC Homes Sold | AVG DOM | # SOLD | AVG SOLD PRICE |
| October 2017 | 51 | 1004 | $ 229,374 |
| October 2018 | 48 | 1088 | $ 240,984 |
| Percentage -/+ | -5.8% | +8.3% | +5% |
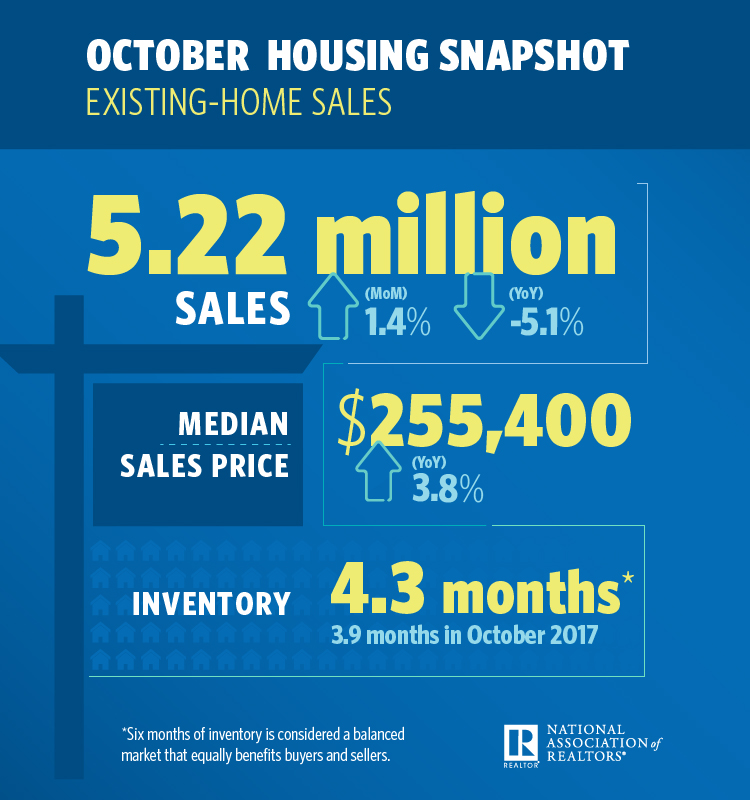
National Real Estate Market
According to the National Association of Realtors® chief economist,Lawrence Yun, increasing housing inventory has brought more buyers to the market. “After six consecutive months of decline, buyers are finally stepping back into the housing market,” he said. “Gains in the Northeast, South and West – a reversal from last month’s steep decline or plateau in all regions – helped overall sales activity rise for the first time since March 2018.”
Existing-home sales in the South rose 1.9 percent to an annual rate of 2.15 million in October, down 2.3 percent from last year. The median price in the South was $221,600, up 3.8 percent from a year ago.
Read more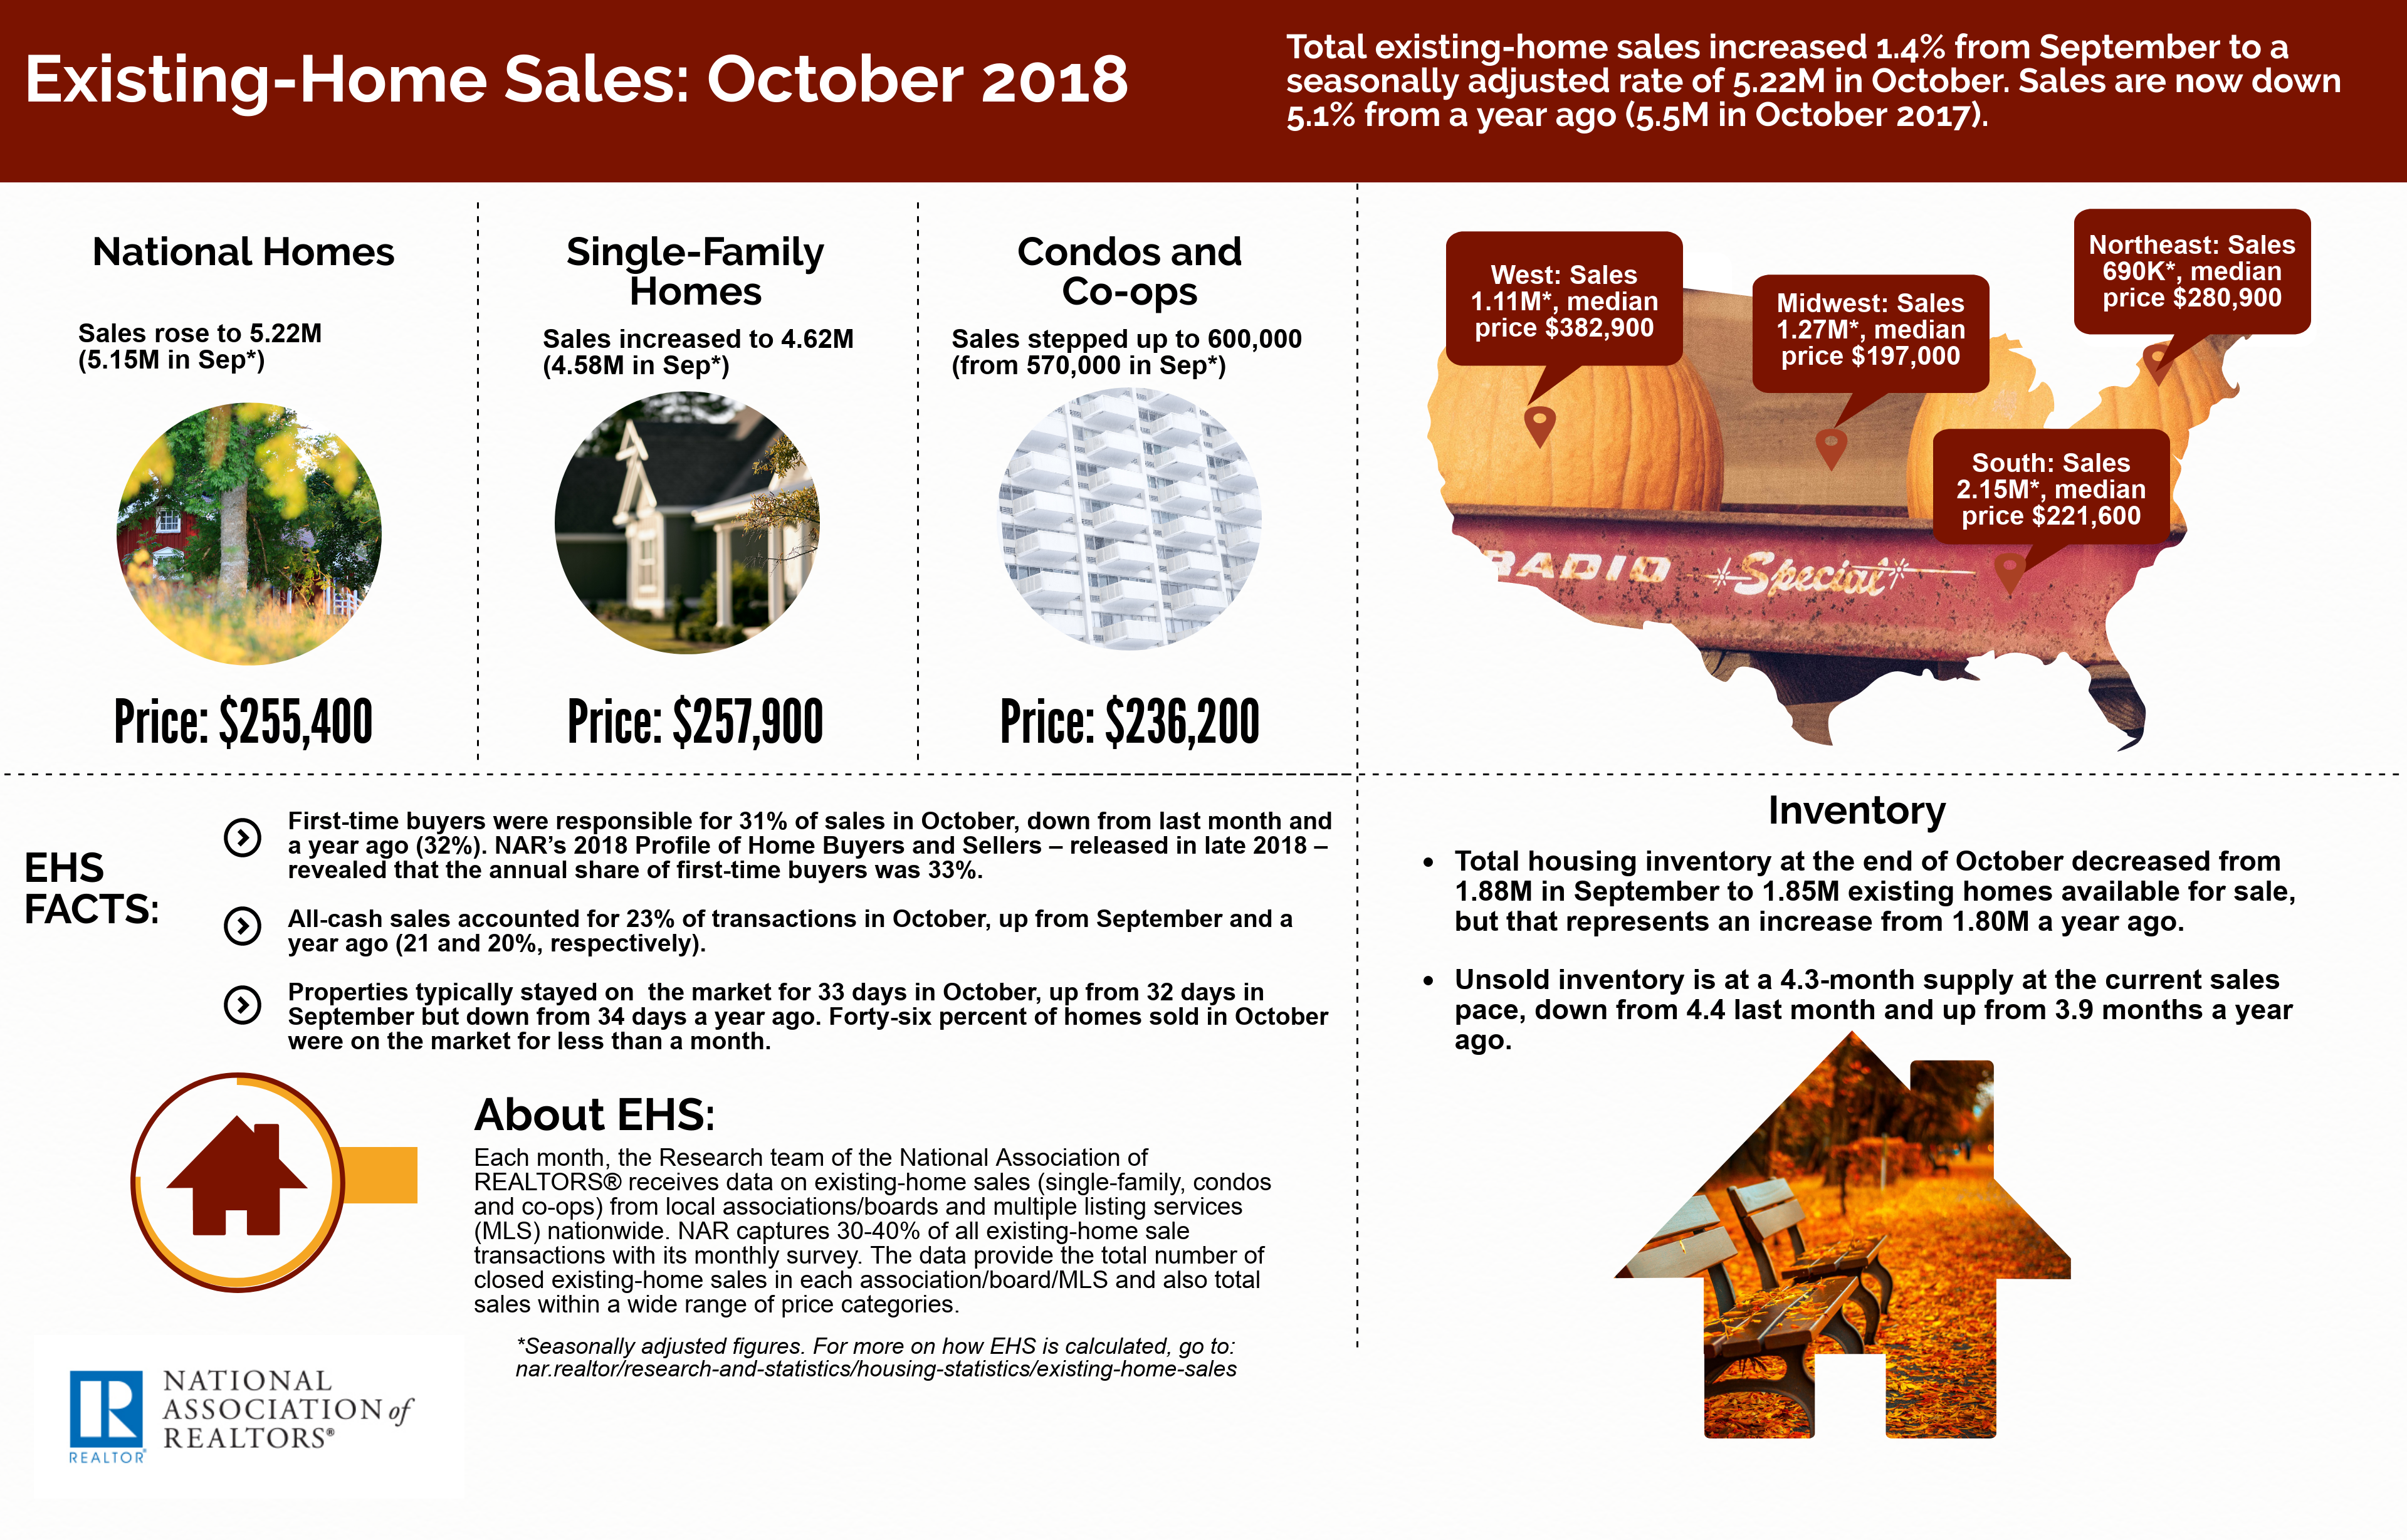

All information/graphs are from the Greater Greenville Association of Realtors® or The National Association of Realtors® and used with permission. All other use restricted.
While representative of market activity, this report may not include all sales brokered by Member firms, and should not be viewed as all inclusive of sales transacted within the referenced time periods.